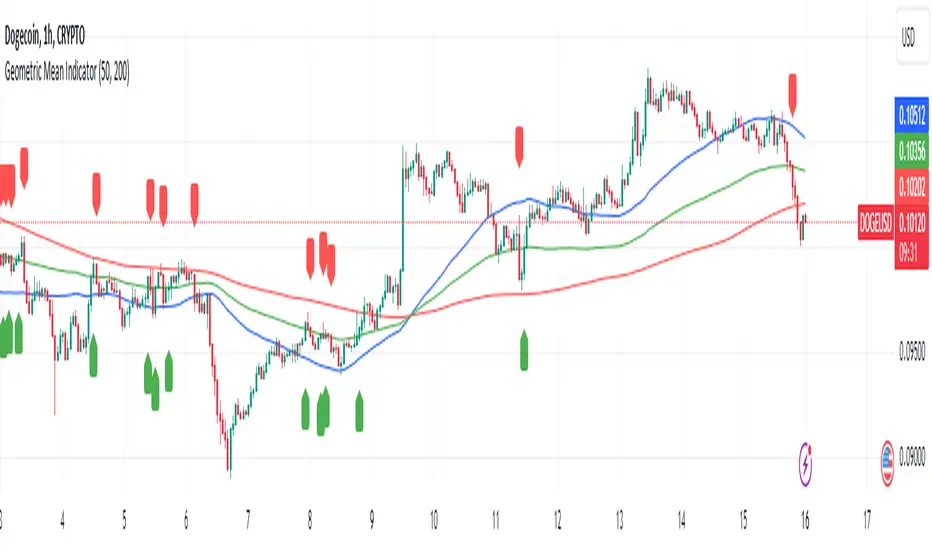
Transient Impact Model [ScorsoneEnterprises]This indicator is an implementation of the Transient Impact Model. This tool is designed to show the strength the current trades have on where price goes before they decay.
Here are links to more sophisticated research articles about Transient Impact Models than this post arxiv.org and arxiv.org
The way this tool is supposed to work in a simple way, is when impact is high price is sensitive to past volume, past trades being placed. When impact is low, it moves in a way that is more independent from past volume. In a more sophisticated system, perhaps transient impact should be calculated for each trade that is placed, not just the total volume of a past bar. I didn't do it to ensure parameters exist and aren’t na, as well as to have more iterations for optimization. Note that the value will change as volume does, as soon as a new candle occurs with no volume, the values could be dramatically different.
How it works
There are a few components to this script, so we’ll go into the equation and then the other functions used in this script.
// Transient Impact Model
transient_impact(params, price_change, lkb) =>
alpha = array.get(params, 0)
beta = array.get(params, 1)
lambda_ = array.get(params, 2)
instantaneous = alpha * volume
transient = 0.0
for t = 1 to lkb - 1
if na(volume )
break
transient := transient + beta * volume * math.exp(-lambda_ * t)
predicted_change = instantaneous + transient
math.pow(price_change - predicted_change, 2)
The parameters alpha, beta, and lambda all represent a different real thing.
Alpha (α):
Represents the instantaneous impact coefficient. It quantifies the immediate effect of the current volume on the price change. In the equation, instantaneous = alpha * volume , alpha scales the current bar's volume (volume ) to determine how much of the price change is due to immediate market impact. A larger alpha suggests that current volume has a stronger instantaneous influence on price.
Beta (β):
Represents the transient impact coefficient.It measures the lingering effect of past volumes on the current price change. In the loop calculating transient, beta * volume * math.exp(-lambda_ * t) shows that beta scales the volume from previous bars (volume ), contributing to a decaying effect over time. A higher beta indicates a stronger influence from past volumes, though this effect diminishes with time due to the exponential decay factor.
Lambda (λ):
Represents the decay rate of the transient impact.It controls how quickly the influence of past volumes fades over time in the transient component. In the term math.exp(-lambda_ * t), lambda determines the rate of exponential decay, where t is the time lag (in bars). A larger lambda means the impact of past volumes decays faster, while a smaller lambda implies a longer-lasting effect.
So in full.
The instantaneous term, alpha * volume , captures the immediate price impact from the current volume.
The transient term, sum of beta * volume * math.exp(-lambda_ * t) over the lookback period, models the cumulative, decaying effect of past volumes.
The total predicted_change combines these two components and is compared to the actual price change to compute an error term, math.pow(price_change - predicted_change, 2), which the script minimizes to optimize alpha, beta, and lambda.
Other parts of the script.
Objective function:
This is a wrapper function with a function to minimize so we get the best alpha, beta, and lambda values. In this case it is the Transient Impact Function, not something like a log-likelihood function, helps with efficiency for a high iteration count.
Finite Difference Gradient:
This function calculates the gradient of the objective function we spoke about. The gradient is like a directional derivative. Which is like the direction of the rate of change. Which is like the direction of the slope of a hill, we can go up or down a hill. It nudges around the parameter, and calculates the derivative of the parameter. The array of these nudged around parameters is what is returned after they are optimized.
Minimize:
This is the function that actually has the loop and calls the Finite Difference Gradient each time. Here is where the minimizing happens, how we go down the hill. If we are below a tolerance, we are at the bottom of the hill.
Applied
After an initial guess, we optimize the parameters and get the transient impact value. This number is huge, so we apply a log to it to make it more readable. From here we need some way to tell if the value is low or high. We shouldn’t use standard deviation because returns are not normally distributed, an IQR is similar and better for non normal data. We store past transient impact values in an array, so that way we can see the 25th and 90th percentiles of the data as a rolling value. If the current transient impact is above the 90th percentile, it is notably high. If below the 25th percentile, notably low. All of these values are plotted so we can use it as a tool.
Tool examples:
The idea around it is that when impact is low, there is room for big money to get size quickly and move prices around.
Here we see the price reacting in the IQR Bands. We see multiple examples where the value above the 90th percentile, the red line, corresponds to continuations in the trend, and below the 25th percentile, the purple line, corresponds to reversals. There is no guarantee these tools will be perfect, that is outlined in these situations, however there is clearly a correlation in this tool and trend.
This tool works on any timeframe, daily as we saw before, or lower like a two minute. The bands don’t represent a direction, like bullish or bearish, we need to determine that by interpreting price action. We see at open and at close there are the highest values for the transient impact. This is to be expected as these are the times with the highest volume of the trading day.
This works on futures as well as equities with the same context. Volume can be attributed to volatility as well. In volatile situations, more volatility comes in, and we can perceive it through the transient impact value.
Inputs
Users can enter the lookback value.
No tool is perfect, the transient impact value is also not perfect and should not be followed blindly. It is good to use any tool along with discretion and price action.
Buscar en scripts para "THE SCRIPT"
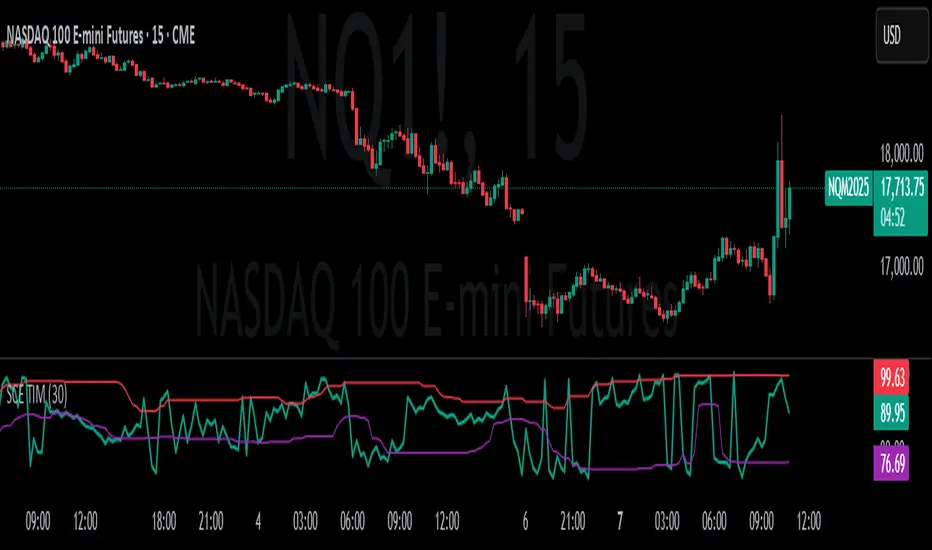
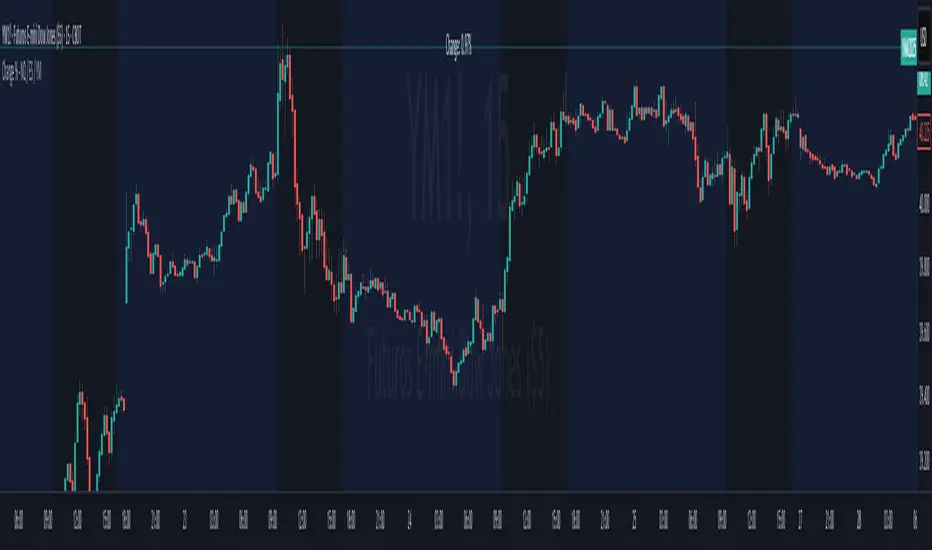
Change % Inteligente - NQ / ES / YMTopstep Compliance: Daily Price Change % Alert (NQ / ES / YM)
Script Purpose
This script helps funded traders (especially those using Topstep or similar programs) monitor the real-time percentage change of major equity index futures: Nasdaq (NQ), S&P 500 (ES), and Dow Jones (YM).
⚠️ Why it matters
Topstep prohibits trading within 2% of the daily price limits set by the CME. If a trader holds a position too close to those limits, they risk account disqualification.
📊 How it works
• Detects the instrument: NQ1!, ES1!, YM1!, or M2025 contracts
• Calculates the real-time % change from today’s market open
• Simulates daily CME price limits (+7% / -7%)
• Highlights when price enters the last 2% of the limit range (prohibited zone)
• Displays a clean, floating panel with the current % change and a warning if necessary
• Sends a visual and optional audio alert when in the prohibited zone
🧠 What makes this script unique?
This tool is **not for technical analysis**. It focuses exclusively on **funding program compliance** and **account protection**, which is not covered by other public scripts. It’s lightweight, intuitive, and designed for traders who manage risk like professionals.
✅ Open-source and ready for review.
✅ CHART SETUP FOR PUBLICATION
✔️ Use a clean chart
✔️ Only apply this script
✔️ Make sure the panel is visible (top-right or top-center recommended)
❌ No extra indicators or drawings
✔️ Use NQM2025, ESM2025 or YMM2025 on a volatile day (to show -1% to -3% range)
INSTRUCTIONS
1. Add the script to your chart.
2. Use it with NQ1!, ES1!, or YM1! (or M2025 contracts).
3. The panel will show today’s price change %.
4. If the market is within the last 2% of the CME price limit, a warning will appear.
5. Use this to avoid violating Topstep’s trading rules during volatile days.
Moving Average Convergence DivergenceThis script is written in Pine Script (version 6) for TradingView and implements the **Moving Average Convergence Divergence (MACD)** indicator. The MACD is a popular momentum oscillator used to identify trend direction, strength, and potential reversals. This version includes customizable inputs, visual enhancements (like crossover markers), and alerts for key events. Below is a detailed explanation of the script:
---
### **1. Purpose**
- The script calculates and displays the MACD line, signal line, and histogram.
- It highlights key events such as MACD/signal line crossovers and zero-line crosses with shapes and colors.
- It provides alerts for changes in the histogram's direction (rising to falling or vice versa).
---
### **2. User Inputs**
- **Fast Length**: Period for the fast moving average (default: 12).
- **Slow Length**: Period for the slow moving average (default: 26).
- **Source**: Data input for calculation (default: closing price, `close`).
- **Signal Smoothing**: Period for the signal line (default: 9, range: 1–50).
- **Oscillator MA Type**: Type of moving average for MACD calculation (options: SMA or EMA, default: EMA).
- **Signal Line MA Type**: Type of moving average for the signal line (options: SMA or EMA, default: EMA).
---
### **3. MACD Calculation**
The MACD is calculated in three parts:
1. **MACD Line**: Difference between the fast and slow moving averages.
- Fast MA: Either SMA or EMA of the source over `fast_length`.
- Slow MA: Either SMA or EMA of the source over `slow_length`.
- Formula: `macd = fast_ma - slow_ma`.
2. **Signal Line**: A moving average (SMA or EMA) of the MACD line over `signal_length`.
- Formula: `signal = sma_signal == "SMA" ? ta.sma(macd, signal_length) : ta.ema(macd, signal_length)`.
3. **Histogram**: Difference between the MACD line and the signal line.
- Formula: `hist = macd - signal`.
---
### **4. Key Events Detection**
#### **MACD/Signal Line Crossovers**
- **Bullish Cross**: MACD crosses above the signal line (`ta.crossover(macd, signal)`).
- **Bearish Cross**: MACD crosses below the signal line (`ta.crossunder(macd, signal)`).
#### **Zero Line Crosses**
- **Cross Above Zero**: MACD crosses above 0 (`ta.crossover(macd, 0)`).
- **Cross Below Zero**: MACD crosses below 0 (`ta.crossunder(macd, 0)`).
---
### **5. Colors**
- **MACD Line**: Green (#089981) if MACD > signal (bullish), red (#f23645) if MACD < signal (bearish).
- **Signal Line**: White (`color.white`).
- **Histogram**:
- Positive (MACD > signal): Light green (#B2DFDB) if decreasing, darker green (#26A69A) if increasing.
- Negative (MACD < signal): Light red (#FFCDD2) if increasing in magnitude, darker red (#FF5252) if decreasing in magnitude.
- **Zero Line**: Gray with 50% transparency (`color.new(#787B86, 50)`).
---
### **6. Visual Outputs**
#### **Plotted Lines**
- **MACD Line**: Plotted with dynamic coloring based on its position relative to the signal line.
- **Signal Line**: Plotted in white.
- **Histogram**: Displayed as columns, with colors indicating direction and momentum.
- **Zero Line**: Horizontal line at 0 for reference.
#### **Shapes for Key Events**
- **Bullish Cross Below Zero**: Green circle on the MACD line when MACD crosses above the signal line while still below zero.
- **Bearish Cross Above Zero**: Red circle on the MACD line when MACD crosses below the signal line while still above zero.
- **Cross Above Zero**: Green upward label at the zero line when MACD crosses above 0.
- **Cross Below Zero**: Red downward label at the zero line when MACD crosses below 0.
---
### **7. Alerts**
- **Rising to Falling**: Triggers when the histogram switches from positive (or zero) to negative.
- Condition: `hist >= 0 and hist < 0`.
- Message: "MACD histogram switched from rising to falling".
- **Falling to Rising**: Triggers when the histogram switches from negative (or zero) to positive.
- Condition: `hist <= 0 and hist > 0`.
- Message: "MACD histogram switched from falling to rising".
---
### **8. How It Works**
1. **Trend Direction**:
- MACD above signal line (green) suggests bullish momentum.
- MACD below signal line (red) suggests bearish momentum.
2. **Momentum Strength**:
- Histogram height shows the strength of the momentum (larger bars = stronger momentum).
- Histogram color changes indicate whether momentum is increasing or decreasing.
3. **Reversal Signals**:
- Crossovers between MACD and signal lines often signal potential trend changes.
- Zero-line crosses indicate shifts between bullish (above 0) and bearish (below 0) territory.
---
### **9. How to Use**
1. Add the script to TradingView.
2. Adjust inputs (e.g., fast/slow lengths, MA types) to suit your trading style.
3. Monitor the chart:
- Green MACD and upward histogram bars suggest bullish conditions.
- Red MACD and downward histogram bars suggest bearish conditions.
- Watch for circles (crossovers) and labels (zero-line crosses) for trade signals.
4. Set up alerts to notify you of histogram direction changes.
---
### **10. Key Features**
- **Customization**: Flexible MA types and periods.
- **Visual Clarity**: Dynamic colors and shapes highlight key events.
- **Alerts**: Notifies users of momentum shifts via histogram changes.
- **Intuitive**: Combines all MACD components (line, signal, histogram) in one indicator.
This script is ideal for traders who rely on MACD for momentum analysis and want clear visual cues and alerts for decision-making.

VIX bottom/top with color scale [Ox_kali]📊 Introduction
━━━━━━━━━━━━━━━━━━━━━━━━━━━━━━━━━━━━━━━━━━━
The “VIX Bottom/Top with Color Scale” script is designed to provide an intuitive, color-coded visualization of the VIX (Volatility Index), helping traders interpret market sentiment and volatility extremes in real time.
It segments the VIX into clear threshold zones, each associated with a specific market condition—ranging from fear to calm—using a dynamic color-coded system.
This script offers significant value for the following reasons:
Intuitive Risk Interpretation: Color-coded zones make it easy to interpret market sentiment at a glance.
Dynamic Trend Detection: A 200-period SMA of the VIX is plotted and dynamically colored based on trend direction.
Customization and Flexibility: All colors are editable in the parameters panel, grouped under “## Color parameters ##”.
Visual Clarity: Key thresholds are marked with horizontal lines for quick reference.
Practical Trading Tool: Helps identify high-risk and low-risk environments based on volatility levels.
🔍 Key Indicators
━━━━━━━━━━━━━━━━━━━━━━━━━━━━━━━━━━━━━━━━━━━
VIX (CBOE Volatility Index) : Measures market volatility and investor fear.
SMA 200 : Long-term trendline of the VIX, with color-coded direction (green = uptrend, red = downtrend).
Color-coded VIX Levels:
🔴 33+ → Something bad just happened
🟠 23–33 → Something bad is happening
🟡 17–23 → Something bad might happen
🟢 14–17 → Nothing bad is happening
✅ 12–14 → Nothing bad will ever happen
🔵 <12 → Something bad is going to happen
🧠 Originality and Purpose
━━━━━━━━━━━━━━━━━━━━━━━━━━━━━━━━━━━━━━━━━━━
Unlike traditional VIX indicators that only plot a line, this script enhances interpretation through visual segmentation and dynamic trend tracking.
It serves as a risk-awareness tool that transforms the VIX into a simple, emotional market map.
This is the first version of the script, and future updates may include alerts, background fills, and more advanced features.
⚙️ How It Works
━━━━━━━━━━━━━━━━━━━━━━━━━━━━━━━━━━━━━━━━━━━
The script maps the current VIX value to a range and applies the corresponding color.
It calculates a SMA 200 and colors it green or red depending on its slope.
It displays horizontal dotted lines at key thresholds (12, 14, 17, 23, 33).
All colors are configurable via input parameters under the group: "## Color parameters ##".
🧭 Indicator Visualization and Interpretation
━━━━━━━━━━━━━━━━━━━━━━━━━━━━━━━━━━━━━━━━━━━
The VIX line changes color based on market condition zones.
The SMA line shows long-term direction with dynamic color.
Horizontal threshold lines visually mark the transitions between volatility zones.
Ideal for quickly identifying periods of fear, caution, or stability.
🛠️ Script Parameters
━━━━━━━━━━━━━━━━━━━━━━━━━━━━━━━━━━━━━━━━━━━
Grouped under “## Color parameters ##”, the following elements are customizable:
🎨 VIX Zone Colors:
33+ → Red
23–33 → Orange
17–23 → Yellow
14–17 → Light Green
12–14 → Dark Green
<12 → Blue
📈 SMA Colors:
Uptrend → Green
Downtrend → Red
These settings allow users to match the script’s visuals to their preferred chart style or theme.
✅ Conclusion
━━━━━━━━━━━━━━━━━━━━━━━━━━━━━━━━━━━━━━━━━━━
The “VIX Bottom/Top with Color Scale” is a clean, powerful script designed to simplify how traders view volatility.
By combining long-term trend data with real-time color-coded sentiment analysis, this script becomes a go-to reference for managing risk, timing trades, or simply staying in tune with market mood.
🧪 Notes
━━━━━━━━━━━━━━━━━━━━━━━━━━━━━━━━━━━━━━━━━━━
This is version 1 of the script. More features such as alert conditions, background fill, and dashboard elements may be added soon. Feedback is welcome!
💡 Color code concept inspired by the original VIX interpretation chart by @nsquaredvalue on Twitter. Big thanks for the visual clarity! 💡
⚠️ Disclaimer
━━━━━━━━━━━━━━━━━━━━━━━━━━━━━━━━━━━━━━━━━━━
This script is a visual tool designed to assist in market analysis. It does not guarantee future performance and should be used in conjunction with proper risk management. Past performance is not indicative of future results.

TimeMapTimeMap is a visual price-reference indicator designed to help traders rapidly visualize how current price levels relate to significant historical closing prices. It overlays your chart with reference lines representing past weekly, monthly, quarterly (3-month), semi-annual (6-month), and annual closing prices. By clearly plotting these historical price references, TimeMap helps traders quickly gauge price position relative to historical market structure, aiding in the identification of trends, support/resistance levels, and potential reversals.
How it Works:
The indicator calculates the precise number of historical bars corresponding to weekly, monthly, quarterly, semi-annual, and annual intervals, dynamically adjusting according to your chart’s timeframe (intraday, daily, weekly, monthly) and chosen market type (Stocks US, Crypto, Forex, or Futures). Historical closing prices from these periods are plotted directly on your chart as horizontal reference lines.
For intraday traders, the script accurately calculates historical offsets considering regular and extended trading sessions (e.g., pre-market and after-hours sessions for US stocks), ensuring correct positioning of historical lines.
User-Configurable Inputs Explained in Detail:
Market Type:
Allows you to specify your trading instrument type, automatically adjusting calculations for:
- Stocks US (default): 390 minutes per regular session (780 minutes if extended hours enabled), 5 trading days/week.
- Crypto: 1440 minutes/day, 7 trading days/week.
- Forex: 1440 minutes/day, 5 trading days/week.
- Futures: 1320 minutes/day, 5 trading days/week.
Show Weekly Close:
When enabled, plots a line at the exact closing price from one week ago. Provides short-term context and helps identify recent price momentum.
Show Monthly Close:
When enabled, plots a line at the exact closing price from one month ago. Helpful for evaluating medium-term price positioning and monthly trend strength.
Show 3-Month Close:
When enabled, plots a line at the exact closing price from three months ago. Useful for assessing quarterly market shifts, intermediate trend changes, and broader market sentiment.
Show 6-Month Close:
When enabled, plots a line at the exact closing price from six months ago. Useful for identifying semi-annual trends, significant price pivots, and longer-term support/resistance levels.
Show 1-Year Close:
When enabled, plots a line at the exact closing price from one year ago. Excellent for assessing long-term market direction and key annual price levels.
Enable Smoothing:
Activates a Simple Moving Average (SMA) smoothing of historical reference lines, reducing volatility and providing clearer visual references. Recommended for traders preferring less volatile reference levels.
Smoothing Length:
Determines the number of bars used in calculating the SMA smoothing of historical lines. Higher values result in smoother but slightly delayed reference lines; lower values offer more immediate yet more volatile levels.
Use Extended Hours (Intraday Only):
When enabled (only applicable for Stocks US), it accounts for pre-market and after-hours trading sessions, providing accurate intraday historical line calculations based on extended sessions (typically 780 minutes/day total).
Important Notes and Compliance:
- This indicator does not provide trading signals, recommendations, or predictions. It serves purely as a visual analytical tool to supplement traders’ existing methods.
- Historical lines plotted are strictly based on past available price data; the indicator never accesses future data or data outside the scope of Pine Script’s standard capabilities.
- The script incorporates built-in logic to avoid runtime errors if insufficient historical data exists for a selected timeframe, ensuring robustness even with limited historical bars.
- TimeMap is original work developed exclusively by Julien Eche (@Julien_Eche). It does not reuse or replicate third-party or existing open-source scripts.
Recommended Best Practices:
- Use TimeMap as a complementary analytical reference, not as a standalone strategy or trade decision-making tool.
- Adapt displayed historical periods and smoothing settings based on your trading style and market approach.
- Default plot colors are optimized for readability on dark-background charts; adjust as necessary according to your preference and chart color scheme.
This script is published open-source to benefit the entire TradingView community and fully complies with all TradingView script publishing rules and guidelines.

Wave N + KDJ + Volumi + SMC + IchimokuWave N + KDJ + Volume + SMC + Ichimoku Indicator
Overview
This script is a multi-layered technical indicator designed to provide traders with enhanced market insights by combining five key methodologies:
• Wave N Pattern (Price Action)
• KDJ Oscillator (Momentum)
• Volume Filtering (Confirmation)
• Smart Money Concepts (Order Blocks) (Institutional Activity)
• Ichimoku Cloud (Trend and Support/Resistance)
By integrating these components, the indicator identifies high-probability trading signals, early warnings of trend shifts, and institutional price zones to improve decision-making in volatile markets.
⸻
How It Works
1️⃣ Wave N Pattern (Price Action Structure)
The Wave N pattern is a classic price action formation that helps spot potential trend reversals and continuations:
• A Bullish Wave N is detected when a higher low and a higher high structure appears.
• A Bearish Wave N is detected when a lower high and a lower low structure forms.
2️⃣ KDJ Oscillator (Momentum & Trend Strength)
The KDJ Indicator is a variation of the Stochastic Oscillator that adds a third line, J, to amplify sensitivity to trend movements.
• J > 50 indicates bullish momentum.
• J < 50 indicates bearish momentum.
• The script includes an early warning signal when J crosses 50, suggesting a possible trend shift.
3️⃣ Volume Filtering (Trade Confirmation)
To avoid false signals, the script integrates volume confirmation:
• A signal is valid only if the volume is above the 20-period EMA of volume.
• This ensures that trade signals are supported by strong market participation.
4️⃣ Smart Money Concepts (Order Blocks)
Order Blocks represent areas of institutional interest, where large traders accumulate or distribute positions.
• The script detects bullish order blocks (potential support) and bearish order blocks (potential resistance).
• These areas help identify optimal entry and exit points.
5️⃣ Ichimoku Cloud (Trend & Dynamic Support/Resistance)
The Ichimoku Cloud is used to confirm trend direction:
• Baseline (Kijun-sen) acts as a key trend filter.
• Senkou Span A & B form the cloud (Kumo), indicating dynamic support/resistance.
• Buy signals require price to be above the baseline, while sell signals require price to be below the baseline.
⸻
Trading Signals & Visual Elements
✅ BUY Signal (Green Arrow)
Occurs when:
• A Bullish Wave N forms
• J > 50 (Bullish KDJ Signal)
• Volume is above EMA threshold
• Price is above the Ichimoku Baseline
❌ SELL Signal (Red Arrow)
Occurs when:
• A Bearish Wave N forms
• J < 50 (Bearish KDJ Signal)
• Volume is above EMA threshold
• Price is below the Ichimoku Baseline
⚠️ Early Warning (Trend Shift Signal)
• An early warning appears when J crosses 50, indicating a possible upcoming trend shift.
• The line color changes based on the potential move:
• Green/Blue → Possible Uptrend
• Red/Orange → Possible Downtrend
⸻
Why This Indicator is Unique?
Unlike simple trend-following indicators, this script:
• Combines Price Action, Momentum, Volume, and Institutional Order Flow for a multi-dimensional approach.
• Filters out weak signals using volume confirmation and Ichimoku.
• Provides early warnings before major trend shifts.
• Visualizes Smart Money Order Blocks, giving traders an edge in spotting institutional zones.
⸻
Best Timeframes & Markets
📊 Recommended Timeframes:
• 1H & 1D (works best on medium/long-term trends)
💹 Markets:
• Crypto, Forex, and Stocks
This indicator is designed for traders who value confluence and strong confirmation in their strategies. Whether you are a trend trader, swing trader, or institutional flow analyst, this tool can help refine your decision-making process.
🚀 Optimize your trades with Wave N + KDJ + Volume + SMC + Ichimoku! 🚀

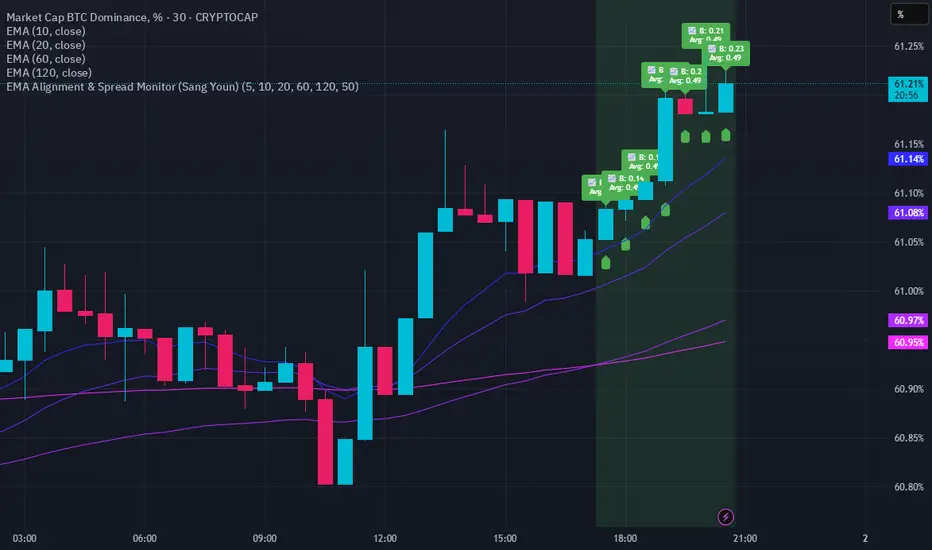
EMA Alignment & Spread Monitor (Sang Youn)Overview
The EMA Alignment & Spread Monitor is a dynamic trading script designed to monitor EMA (Exponential Moving Average) alignments, track spread deviations, and provide real-time alerts when significant conditions are met. This script allows traders to customize their EMA periods, analyze market trends based on EMA positioning, and receive visual and audio alerts when key spread conditions occur.
🔹 Key Features
✅ Customizable EMA Periods – Users can input their own EMA lengths to adapt the script to various market conditions. (Default: 5, 10, 20, 60, 120)
✅ EMA Alignment Detection – Identifies bullish alignment (all EMAs in ascending order) and bearish alignment (all EMAs in descending order).
✅ Spread Calculation & Monitoring – Computes the spread difference between each EMA and tracks the average spread over a user-defined period.
✅ Deviation Alerts – Notifies traders when:
Bullish Trend: The spread exceeds its average, indicating a potential strong uptrend.
Bearish Trend: The spread falls below its average, signaling a possible downtrend.
✅ Chart Annotations – Displays 📈 (green triangle) when bullish spread exceeds average and 📉 (red triangle) when bearish spread drops below average for easy visualization.
✅ Real-time Alerts – Sends alerts when spread conditions are met, helping traders react to market shifts efficiently.
✅ Spread Histogram – Visual representation of bullish and bearish spread levels for trend analysis.
🔹 How It Works
1️⃣ Set your EMA periods in the script settings (default: 5, 10, 20, 60, 120).
2️⃣ Define the spread average calculation length (default: 50 candles).
3️⃣ The script tracks EMA alignment to determine bullish or bearish trends.
4️⃣ If the spread deviates significantly from its average, the script:
Places a 📈 green triangle above candles in a bullish trend when spread > average.
Places a 📉 red triangle below candles in a bearish trend when spread < average.
Triggers an alert for timely decision-making.
5️⃣ Use the histogram & real-time alerts to stay ahead of market movements.
Time-based Alerts for Trading Windows🌟 Time-based Alerts for Trading Windows 🌐📈
This is a re-uploaded script as the previous one got hidden.
This Time-based Alerts for Trading Windows script is a highly customizable and reliable tool designed to assist traders in managing automated strategies or manually monitoring specific market conditions. Inspired by CrossTrade's Time-based Alert, this script is tailored for those who rely on precise time windows to trigger actions, such as sending webhook signals or managing Expert Advisors (EAs).
Whether you are a scalper, day trader, or algorithmic trader, this script empowers you to stay on top of your trades with fully customizable time-based alerts.
🛠️ Customizable Time Alerts
This indicator allows you to create up to 12 unique time windows by specifying the exact hour and minute for each alert. Each time window corresponds to an individual alert condition, making it perfect for managing trades during specific market sessions or key time periods.
For example:
Alert 1 can be set at 9:30 AM (market open).
Alert 2 can be set at 3:55 PM (just before market close).
Each alert can be toggled on or off in the indicator settings, allowing you to manage alerts without having to reconfigure your script.
You can adjust the colours to fit any colour scheme you like!
🕒 Odd and Even Time Alerts
The script comes with three built-in alert type categories:
Odd Alerts (marked with a green triangle on the chart): These correspond to odd-numbered inputs like Alert 1, Alert 3, Alert 5, and so on.
Even Alerts (marked with a red triangle on the chart): These correspond to even-numbered inputs like Alert 2, Alert 4, Alert 6, and so on.
You can also customize all 12 alerts individually to include a custom alert message
These alerts serve as a convenient way to differentiate between multiple trading strategies or market conditions. You can customize alert messages for odd and even alerts directly from TradingView’s alert panel.
🔗 Webhook Integration for Automation
This script is fully compatible with webhook-based automation. By configuring your alerts in TradingView, you can send signals to trading bots, EAs, or any third-party system. For example, you can:
Turn off an EA at a specific time (e.g., 3:55 PM EST).
Send buy/sell signals to your bot during predefined trading windows.
Simply use TradingView’s alert message editor to format webhook payloads for your automation system.
🌐 Timezone Flexibility
Trading happens across multiple time zones, and this script accounts for that. You can toggle between:
Eastern Time (New York): Ideal for most US-based markets.
Central Time (Exchange): Useful for futures and commodities traders.
This ensures your alerts are always in sync with your preferred time zone, eliminating confusion.
🎨 Visual Indicators
The script plots visual markers directly on your chart to indicate active alerts:
Up Facing Triangles: Represent odd-numbered alerts, providing a quick reference for these time windows.
Down Facing Triangles: Represent even-numbered alerts, helping you track different strategies or conditions.
These visual markers make it easy to see when alerts are triggered, even at a glance.
📈 Practical Use Case
Let’s say you’re trading the USTEC index on a 1-minute chart. You want to:
Turn off your trading bot at 16:55 EST to avoid after-market volatility.
Trigger a re-entry signal at 17:30 EST to capture moves during the Asian session.
Visually monitor these actions on your chart for easy reference.
This script makes it possible with precision alerts and webhook integration. Simply configure the time windows in the settings and set up your alerts in TradingView.
🚨 How to Set Up Alerts
Enable or Disable Alerts: Use the script’s settings to toggle specific alerts on or off as needed.
Set Custom Time Windows: Define the hour and minute for each alert in the settings panel.
Create Alerts in TradingView:
Go to the TradingView alert panel.
Select the condition (e.g., "Odd Time-based Alert (Green)" or "Even Time-based Alert (Red)").
Customize the alert message for webhook integration or personal notification.
Choose the trigger type: Once Per Bar or Once Per Bar Close to keep the alert active.
Integrate with Webhooks: Use the alert message field to format payloads for automation systems like MT4, MT5, or third-party bots.
📋 Key Notes
Alerts can trigger indefinitely if set to "Once Per Bar" or "Once Per Bar Close".
Always ensure the expiration date is set far in the future to avoid unexpected alert deactivation.
Test webhook messages and alert configurations thoroughly before using them in live trading.
This script is a powerful addition to your trading toolbox, offering precision, flexibility, and automation capabilities. Whether you’re turning off an EA, managing trades during market sessions, or automating strategies via webhooks, this script is here to support you.
Start using the Time-based Alerts for Trading Windows today and trade with confidence! 🚀✨

Multi-indicator Signal Builder [Skyrexio]Overview
Multi-Indicator Signal Builder is a versatile, all-in-one script designed to streamline your trading workflow by combining multiple popular technical indicators under a single roof. It features a single-entry, single-exit logic, intrabar stop-loss/take-profit handling, an optional time filter, a visually accessible condition table, and a built-in statistics label. Traders can choose any combination of 12+ indicators (RSI, Ultimate Oscillator, Bollinger %B, Moving Averages, ADX, Stochastic, MACD, PSAR, MFI, CCI, Heikin Ashi, and a “TV Screener” placeholder) to form entry or exit conditions. This script aims to simplify strategy creation and analysis, making it a powerful toolkit for technical traders.
Indicators Overview
1. RSI (Relative Strength Index)
Measures recent price changes to evaluate overbought or oversold conditions on a 0–100 scale.
2. Ultimate Oscillator (UO)
Uses weighted averages of three different timeframes, aiming to confirm price momentum while avoiding false divergences.
3. Bollinger %B
Expresses price relative to Bollinger Bands, indicating whether price is near the upper band (overbought) or lower band (oversold).
4. Moving Average (MA)
Smooths price data over a specified period. The script supports both SMA and EMA to help identify trend direction and potential crossovers.
5. ADX (Average Directional Index)
Gauges the strength of a trend (0–100). Higher ADX signals stronger momentum, while lower ADX indicates a weaker trend.
6. Stochastic
Compares a closing price to a price range over a given period to identify momentum shifts and potential reversals.
7. MACD (Moving Average Convergence/Divergence)
Tracks the difference between two EMAs plus a signal line, commonly used to spot momentum flips through crossovers.
8. PSAR (Parabolic SAR)
Plots a trailing stop-and-reverse dot that moves with the trend. Often used to signal potential reversals when price crosses PSAR.
9. MFI (Money Flow Index)
Similar to RSI but incorporates volume data. A reading above 80 can suggest overbought conditions, while below 20 may indicate oversold.
10. CCI (Commodity Channel Index)
Identifies cyclical trends or overbought/oversold levels by comparing current price to an average price over a set timeframe.
11. Heikin Ashi
A type of candlestick charting that filters out market noise. The script uses a streak-based approach (multiple consecutive bullish or bearish bars) to gauge mini-trends.
12. TV Screener
A placeholder condition designed to integrate external buy/sell logic (like a TradingView “Buy” or “Sell” rating). Users can override or reference external signals if desired.
Unique Features
1. Multi-Indicator Entry and Exit
You can selectively enable any subset of 12+ classic indicators, each with customizable parameters and conditions. A position opens only if all enabled entry conditions are met, and it closes only when all enabled exit conditions are satisfied, helping reduce false triggers.
2. Single-Entry / Single-Exit with Intrabar SL/TP
The script supports a single position at a time. Once a position is open, it monitors intrabar to see if the price hits your stop-loss or take-profit levels before the bar closes, making results more realistic for fast-moving markets.
3. Time Window Filter
Users may specify a start/end date range during which trades are allowed, making it convenient to focus on specific market cycles for backtesting or live trading.
4. Condition Table and Statistics
A table at the bottom of the chart lists all active entry/exit indicators. Upon each closed trade, an integrated statistics label displays net profit, total trades, win/loss count, average and median PnL, etc.
5. Seamless Alerts and Automation
Configure alerts in TradingView using “Any alert() function call.”
The script sends JSON alert messages you can route to your own webhook.
The indicator can be integrated with Skyrexio alert bots to automate execution on major cryptocurrency exchanges
6. Optional MA/PSAR Plots
For added visual clarity, optionally plot the chosen moving averages or PSAR on the chart to confirm signals without stacking multiple indicators.
Methodology
1. Multi-Indicator Entry Logic
When multiple entry indicators are enabled (e.g., RSI + Stochastic + MACD), the script requires all signals to align before generating an entry. Each indicator can be set for crossovers, crossunders, thresholds (above/below), etc. This “AND” logic aims to filter out low-confidence triggers.
2. Single-Entry Intrabar SL/TP
One Position At a Time: Once an entry signal triggers, a trade opens at the bar’s close.
Intrabar Checks: Stop-loss and take-profit levels (if enabled) are monitored on every tick. If either is reached, the position closes immediately, without waiting for the bar to end.
3. Exit Logic
All Conditions Must Agree: If the trade is still open (SL/TP not triggered), then all enabled exit indicators must confirm a closure before the script exits on the bar’s close.
4. Time Filter
Optional Trading Window: You can activate a date/time range to constrain entries and exits strictly to that interval.
Justification of Methodology
Indicator Confluence: Combining multiple tools (RSI, MACD, etc.) can reduce noise and false signals.
Intrabar SL/TP: Capturing real-time spikes or dips provides a more precise reflection of typical live trading scenarios.
Single-Entry Model: Straightforward for both manual and automated tracking (especially important in bridging to bots).
Custom Date Range: Helps refine backtesting for specific market conditions or to avoid known irregular data periods.
How to Use
1. Add the Script to Your Chart
In TradingView, open Indicators , search for “Multi-indicator Signal Builder”.
Click to add it to your chart.
2. Configure Inputs
Time Filter: Set a start and end date for trades.
Alerts Messages: Input any JSON or text payload needed by your external service or bot.
Entry Conditions: Enable and configure any indicators (e.g., RSI, MACD) for a confluence-based entry.
Close Conditions: Enable exit indicators, along with optional SL (negative %) and TP (positive %) levels.
3. Set Up Alerts
In TradingView, select “Create Alert” → Condition = “Any alert() function call” → choose this script.
Entry Alert: Triggers on the script’s entry signal.
Close Alert: Triggers on the script’s close signal (or if SL/TP is hit).
Skyrexio Alert Bots: You can route these alerts via webhook to Skyrexio alert bots to automate order execution on major crypto exchanges (or any other supported broker).
4. Visual Reference
A condition table at the bottom summarizes active signals.
Statistics Label updates automatically as trades are closed, showing PnL stats and distribution metrics.
Backtesting Guidelines
Symbol/Timeframe: Works on multiple assets and timeframes; always do thorough testing.
Realistic Costs: Adjust commissions and potential slippage to match typical exchange conditions.
Risk Management: If using the built-in stop-loss/take-profit, set percentages that reflect your personal risk tolerance.
Longer Test Horizons: Verify performance across diverse market cycles to gauge reliability.
Example of statistic calculation
Test Period: 2023-01-01 to 2025-12-31
Initial Capital: $1,000
Commission: 0.1%, Slippage ~5 ticks
Trade Count: 468 (varies by strategy conditions)
Win rate: 76% (varies by strategy conditions)
Net Profit: +96.17% (varies by strategy conditions)
Disclaimer
This indicator is provided strictly for informational and educational purposes .
It does not constitute financial or trading advice.
Past performance never guarantees future results.
Always test thoroughly in demo environments before using real capital.
Enjoy exploring the Multi-Indicator Signal Builder! Experiment with different indicator combinations and adjust parameters to align with your trading preferences, whether you trade manually or link your alerts to external automation services. Happy trading and stay safe!

Buy Signal Forex & Crypto v0 ImprovedPurpose of the Script:
This script is designed to generate buy and sell signals for trading Forex and cryptocurrencies by analyzing price trends using exponential moving averages (EMAs), volatility, and volume filters. The signals are displayed as arrows on the chart.
What the Script Does
Input Settings:
The script allows the user to configure various settings, such as the lengths of EMAs, a higher timeframe for trend confirmation, and thresholds for volume and volatility (ATR - Average True Range).
Key settings:
5 EMA Length – Length of the short-term EMA.
13 EMA Length – Length of the medium-term EMA.
26 EMA Length – Length of the long-term EMA.
21 EMA Length – Used for trend confirmation on a higher timeframe.
Higher Timeframe – Lets you select a timeframe (e.g., daily) for confirming the overall trend.
ATR Threshold – Filters out signals when the market's volatility is too low.
Volume Filter – Ensures sufficient trading activity before generating signals.
Calculating EMAs (Exponential Moving Averages):
Four EMAs are calculated:
ema5 (short-term), ema13 (medium-term), ema26 (long-term), and ema21 (higher timeframe confirmation).
These EMAs help determine price trends and crossovers, which are critical for identifying buy and sell opportunities.
Trend Confirmation Using a Higher Timeframe:
The 21 EMA on the higher timeframe (e.g., daily) is used to confirm the overall direction of the market.
Defining Signal Conditions:
Buy Signal:
A buy signal is generated when:
ema5 crosses above ema13 (indicating a bullish trend).
ema5 crosses above ema26 (stronger bullish confirmation).
The closing price is above ema5, ema13, ema26, and the 21 EMA on the higher timeframe.
The market's volatility (ATR) is above the defined threshold.
The volume meets the conditions or volume filtering is disabled.
Sell Signal:
A sell signal is generated when:
ema5 crosses below ema13 (indicating a bearish trend).
ema5 crosses below ema26 (stronger bearish confirmation).
The closing price is below ema5, ema13, ema26, and the 21 EMA on the higher timeframe.
The market's volatility (ATR) is above the defined threshold.
The volume meets the conditions or volume filtering is disabled.
Volume Filtering:
Ensures there’s enough trading activity by comparing the current volume to a 20-period moving average of volume.
Persistent Variables:
These variables (crossed13 and crossed13Sell) help track whether the short-term EMA (ema5) has crossed the medium-term EMA (ema13). This prevents false or repeated signals.
Displaying Signals on the Chart:
Buy signals are displayed as green upward arrows below the price.
Sell signals are displayed as red downward arrows above the price.
How It Helps Traders:
This script provides visual cues for potential entry and exit points by combining moving average crossovers, volatility, volume, and higher timeframe trend confirmation. It works well for trending markets and ensures signals are filtered for stronger conditions to reduce noise.

SW monthly Gann Days**Script Description:**
The script you are looking at is based on the work of W.D. Gann, a famous trader and market analyst in the early 20th century, known for his use of geometry, astrology, and numerology in market analysis. Gann believed that certain days in the market had significant importance, and he observed that markets often exhibited significant price moves around specific dates. These dates were typically associated with cyclical patterns in price movements, and Gann referred to these as "Gann Days."
In this script, we have focused on highlighting certain days of the month that Gann believed to have an influence on market behavior. The specific days in question are the **6th to 7th**, **9th to 10th**, **14th to 15th**, **19th to 20th**, **23rd to 24th**, and **29th to 31st** of each month. These ranges are based on Gann’s theory that there are recurring time cycles in the market that cause turning points or critical price movements to occur around certain days of the month.
### **Why Gann Used These Days:**
1. **Mathematical and Astrological Cycles:**
Gann believed that markets were influenced by natural cycles, and that certain dates (or combinations of dates) played a critical role in the price movements. These specific days are part of his broader theory of "time cycles" where the market would often change direction, reverse, or exhibit significant volatility on particular days. Gann's research was based on both mathematical principles and astrological observations, leading him to assign importance to these days.
2. **Gann's Universal Timing Theory:**
According to Gann, financial markets operate in a universe governed by geometric and astrological principles. These cycles repeat themselves over time, and specific days in a given month correspond to key turning points within these repeating cycles. Gann found that the 6th to 7th, 9th to 10th, 14th to 15th, 19th to 20th, 23rd to 24th, and 29th to 31st often marked significant changes in the market, making them particularly important for traders to watch.
3. **Market Psychology and Sentiment:**
These specific days likely correspond to key moments where market participants tend to react in predictable ways, influenced by past market behavior on similar dates. For example, news events or scheduled economic reports might fall within these time windows, causing the market to respond in a particular way. Gann's method involves using these cyclical patterns to predict turning points in market prices, enabling traders to anticipate when the market might make a reversal or face a significant shift in direction.
4. **Turning Points:**
Gann believed that markets often reversed or encountered critical points around specific dates. This is why he considered certain days more important than others. By identifying and focusing on these days, traders can better anticipate the market’s movement and make more informed trading decisions.
5. **Numerology:**
Gann also utilized numerology in his trading system, believing that numbers, and particularly certain key numbers, had significance in predicting market movements. The days selected in this script may correspond to numerological patterns that Gann identified in his analysis of the markets, such as recurring numbers in his astrological and geometric systems.
### **Purpose of the Script:**
This script highlights these "Gann Days" within a trading chart for 2024 and 2025. The color-coding or background highlighting is intended to draw attention to these dates, so traders can observe the potential for significant market movements during these times. By identifying these specific dates, traders following Gann's theories may gain insights into possible turning points, corrections, or key price movements based on the market's historical behavior around these days.
Overall, Gann’s use of specific days was based on his deep belief in the cyclical nature of the market and his attempt to tie those cycles to the natural laws of time, geometry, and astrology. By focusing on these dates, Gann aimed to give traders an edge in predicting significant market events and price shifts.

Uptrick: Arbitrage OpportunityINTRODUCTION
This script, titled Uptrick: Arbitrage Monitor, is a Pine Script™ indicator that aims to help traders quickly visualize potential arbitrage scenarios across multiple cryptocurrency exchanges. Arbitrage, in general, involves taking advantage of price differences for the same asset across different trading platforms. By comparing market prices of the same symbol on two user-selected exchanges, as well as scanning a broader list of exchanges, this script attempts to signal areas where you might want to buy on one exchange and sell on another. It includes various graphical tools, calculations, and an optional Automated Detection signal feature, allowing users to incorporate more advanced data scanning into their trading decisions. Keep in mind that transaction fees must also be considered in real-world scenarios. These fees can negate potential profits and, in some cases, result in a net loss.
PURPOSE
The primary purpose of this indicator is to show potential percentage differences between the same cryptocurrency trading pairs on two different exchanges. This difference is displayed numerically, visually as a line chart, and it is also tested against user-defined thresholds. With the threshold in place, buy and sell signals can be generated. The script allows you to quickly gauge how significant a spread is between two exchanges and whether that spread surpasses a specified threshold. This is particularly useful for arbitrage trading, where an asset is bought at a lower price on one exchange and sold at a higher price on another, capitalizing on price discrepancies. By identifying these opportunities, traders can potentially secure profits across different markets.
WHY IT WAS MADE
This script was developed to help traders who frequently look for arbitrage opportunities in the fast-paced cryptocurrency market. Cryptocurrencies sometimes experience quick price divergences across different exchanges. By having an automated approach that compares and displays prices, traders can spend less time manually tracking price discrepancies and more time focusing on actual trading strategies. The script was also made with user customization in mind, allowing you to toggle an optional Automated-based approach and choose different moving average methods to smooth out the displayed price difference.
WHAT ARBITRAGE IS
Arbitrage is the practice of buying an asset on one market (or exchange) at a lower price and simultaneously selling it on another market where the price is higher, thus profiting from the price difference. In cryptocurrency markets, these price differentials can occur across multiple exchanges due to varying liquidity, trading volume, geographic factors, or market inefficiencies. Though sometimes small, these differences can be exploited for profit when approached methodically.
EXPLANATION OF INPUTS
The script includes a variety of user inputs that help tailor the indicator to your specific needs:
1. Compared Symbol 1: This is the primary symbol you want to track (for example, BTCUSDT). Make sure it's written in all capital and make sure that it's price from that exchange is available on Tradingview.
2. Compare Exchange 1: The first exchange on which the script will request pricing data for the chosen symbol.
3. Compared to Exchange: The second exchange, used for the comparison.
4. Opportunity Threshold (%): A percentage threshold that, when exceeded by the price difference, can trigger buy or sell signals.
5. Plot Style?: Allows you to choose between plotting the raw difference line or a moving average of that difference.
6. MA Type: Select among SMA, EMA, WMA, RMA, or HMA for your moving average calculation.
7. MA Length: The lookback period for the selected moving average.
8. Plot Buy/Sell Signals?: Enables or disables the plotting of arrows signaling potential buy or sell zones based on threshold crossovers.
9. Automated Detection?: Toggles an additional multi-exchange data scan feature that calculates the highest and lowest prices for the specified symbol across a predefined list of exchanges.
CALCULATIONS
At its core, the script calculates price1 and price2 using the request.security function to fetch close prices from two selected exchanges. The difference is measured as (price1 - price2) / price2 * 100. This results in a percentage that indicates how much higher or lower price1 is relative to price2. Additionally, the script calculates a slope for this difference, which helps color the line depending on whether it is trending up or down. If you choose the moving average option, the script will replace the raw difference data with one of several moving average calculations (SMA, EMA, WMA, RMA, or HMA).
The script also includes an iterative scan of up to 15 different exchanges for Automated detection, collecting the highest and lowest price across all those exchanges. If the Automated option is enabled, it compiles a potential recommendation: buy at the cheapest exchange price and sell at the most expensive one. The difference across all exchanges (allExDiffPercent) is calculated using (highestPriceAll - lowestPriceAll) / lowestPriceAll * 100.
WHAT AUTOMATED DETECTION SIGNAL DOES
If enabled, the Automated detection feature scans all 15 supported exchanges for the specified symbol. It then identifies the exchange with the highest price and the exchange with the lowest price. The script displays a recommended action: buy on the lowest-exchange price and sell on the highest-exchange price. While called “Automated,” it is essentially a multi-exchange data query that automates a portion of research by consolidating different price points. It does not replace thorough analysis or guaranteed execution; it simply provides an overview of potential extremes.
WHAT ALL-EX-DIFF IS
The variable allExDiffPercent is used to show the overall difference between the highest price and the lowest price found among the 15 pre-chosen exchanges. This figure can be useful for anyone wanting a big-picture view of how large the arbitrage spread might be across the broader market.
SIGNALS AND HOW THEY ARE GENERATED
The script provides two main modes of signal generation:
1. Raw Difference Mode: If the user chooses “Use Normal Line,” the script compares the percentage difference of the two selected exchanges (price1 and price2) to the user-defined threshold. When the difference crosses under the positive threshold, a sell signal is displayed (red arrow). Conversely, when the difference crosses above the negative threshold, a buy signal is displayed (green arrow).
2. Moving Average Mode: If the user selects “Use Moving Average,” the script instead references the moving average values (maValue). The signals fire under similar conditions but use the average line to gauge whether the threshold has been crossed.
HOW TO USE THE INDICATOR
1. Add the script to your chart in TradingView.
2. In the script’s settings panel, configure the symbol you wish to compare (for example, BTCUSDT), choose the two exchanges you want to evaluate, and set your desired threshold.
3. Optionally, pick a moving average type and length if you prefer a smoother representation of the difference.
4. Enable or disable buy/sell signals according to your preference.
5. If you’d like to see potential extremes among a broader list of exchanges, enable Automated Detection. Keep in mind that this feature runs additional security requests, so it might slow down performance on weaker devices or if you already have many scripts running.
EXCHANGES TO USE
The script currently supports up to 15 exchanges: BYBIT, BINANCE, MEXC, BLOFIN, BITGET, OKX, KUCOIN, COINBASE, COINEX, PHEMEX, POLONIEX, GATEIO, BITSTAMP, and KRAKEN. You can choose any two of these for direct comparison, and if you enable the Automated detection, it will attempt to query them all to find extremes in real time.
VISUALS
The exchanges and current prices & differences are all plotted in the table while the colored line represents the difference in the price. The two thresholds colored red are where signals are generated. A cross below the upper threshold is a sell signal and a cross above the lower threshold is a buy signal. In the line at the bottom, purple is a negative slope and aqua is a positive slope.
LIMITATIONS AND POTENTIAL PROBLEMS
If you enable too many visual elements such as signals, additional lines, and the Automated-based scanning table, you may find that your chart becomes cluttered, or text might overlap. One workaround is to remove and reapply the indicator to refresh its display. You may also want to reduce the number of displayed table rows by disabling some features if your chart becomes too crowded. Sometimes there might be an error that the price of an asset is not available on an exchange, to fix this, go and select another exchange to compare it to, or if it happens in Automated detection, choose a different asset, ideally more widely spread.
UNIQUENESS
This indicator stands out due to its multifaceted approach: it doesn’t just look at two exchanges but optionally scans up to 15 exchanges in real time, presenting users with a much broader view of the market. The dual-mode system (raw difference vs. moving average) allows for both immediate, unfiltered signals and smoother, noise-reduced signals depending on user preference. By default, it introduces dynamic visual cues through color changes when the slope of the difference transitions upward or downward. The optional Automated detection, while not a deep learning system, adds a functional intelligence layer by collating extreme price points from multiple exchanges in one place, thereby streamlining the manual research process. This combination of features gives the script a unique edge in the TradingView ecosystem, catering equally to novices wanting a straightforward approach and to advanced users looking for an aggregated multi-exchange analysis.
CONCLUSION
Uptrick: Arbitrage Monitor is a versatile and customizable Pine Script™ indicator that highlights price differences for a specified symbol between two user-selected exchanges. Through signals, threshold-based alerts, and optional Automated detection across multiple exchanges, it aims to support traders in identifying potential arbitrage opportunities quickly and efficiently. This script makes no guarantees of profitability but can serve as a valuable tool to add to your trading toolkit. Always use caution when implementing arbitrage strategies, and be mindful of market risks, exchange fees, and latency.
ADDITIONAL DISCLOSURES
This script is provided for educational and informational purposes only. It does not constitute financial advice or a guarantee of performance. Users are encouraged to conduct thorough research and consider the inherent risks of arbitrage trading. Market conditions can change rapidly, and orders may fail to execute at desired prices, especially when large price discrepancies attract competition from other traders.

1-3-1 Strat Combo with 50% Level (12h)Logic Explanation
1-3-1 Combo Detection:
The script detects the 1-3-1 pattern using the previous 3 candles:
Candle 4: Inside Bar (Type 1).
Candle 3: Outside Bar (Type 3).
Candle 2: Inside Bar (Type 1).
4th Candle Behavior:
If the 4th candle (current bar):
Stays an inside bar (Type 1) → isFourthInsideBar is true.
Becomes a directional bar (Type 2) → isFourthDirectional is true.
If either of these conditions is true, the script stops calculating and waits for the next valid 1-3-1 setup.
50% Level Calculation:
If the conditions are not met (e.g., the 4th candle doesn’t stop the pattern), the script:
Plots a dotted line at the 50% level of the 3rd candle.
Adds a label showing the 50% level.
Stop Calculations:
No line, box, or label is drawn if the 4th candle is a Type 1 (inside bar) or Type 2 (directional bar).
Visual Outputs:
Dotted Box: Marks the 1-3-1 combo setup.
50% Line: Drawn only if the 4th candle does not invalidate the pattern.
Label: Displays the 50% level of the 3rd candle.
How to Use:
Apply this script on the 12-hour chart.
The script will:
Detect valid 1-3-1 patterns.
Stop drawing any calculations if the 4th candle is an inside bar (1) or a directional bar (2).
Wait for the next valid 1-3-1 combo.

IPO Lifecycle Sell Strategy [JARUTIR]IPO Lifecycle Sell Strategy with Dynamic Buy Date and Multiple Sell Rules
This custom TradingView script is designed for traders looking to capitalize on dynamic strategies for IPOs and growth stocks, by implementing several sell rules based on price action and technical indicators. It provides a set of sell rules that are applied dynamically depending on the stock's lifecycle and price action, allowing users to lock in profits and minimize drawdowns based on key technical thresholds.
The four sell strategies incorporated into this script are inspired by the book "The Lifecycle Trade", a resource that focuses on capturing profits while managing risk in different phases of a stock's lifecycle, from IPO to high-growth stages.
Key Features:
Buy Price and Buy Date: You can either manually input your buy price and date or let the script automatically detect the buy date based on the specified buy price.
Multiple Sell Strategies: Choose from 4 predefined sell strategies:
Ascender Rule : Captures strong momentum from IPO stocks by selling portions at specific price levels or technical conditions.
Midterm Rule : Focuses on holding for longer periods, with defensive sell signals triggered when the stock deviates significantly from peak price or key moving averages.
40 Week Rule : Designed for long-term holds, this rule triggers a sell when the stock closes below the 40-week moving average.
Everest Rule : Aggressive strategy for selling into strength based on parabolic moves or gap downs, ideal for high momentum stocks.
Interactive Features:
Horizontal Green Line showing the buy price level from the buy date.
Visual Sell Signals appear only after the buy date to ensure that your analysis is relevant to the stock lifecycle.
Customizable settings, allowing you to choose your preferred sell rule strategy and automate buy date detection.
This script is perfect for traders using a strategic, systematic approach to IPOs and high-growth stocks, whether you're looking for quick exits during momentum phases or holding for longer-term growth.
Usage:
Input your Buy Price and Buy Date, or allow the script to automate the buy date detection.
Select a Sell Rule strategy based on your risk profile and trading style.
View visual signals for selling when specific conditions are met.
Frequently Asked Questions (FAQs):
Q1: How do I input my Buy Price and Buy Date?
The script allows you to either manually input the Buy Price and Buy Date or use the automated detection. If you choose automated detection, the script will automatically assign the buy date when the price crosses above your set Buy Price.
Q2: What is the purpose of the "Sell Rules"?
The script offers four sell strategies to help manage different types of stocks in varying phases of their lifecycle:
Ascender Rule: Targets IPO stocks showing positive momentum.
Midterm Rule: A defensive strategy for stocks in a steady uptrend.
40 Week Rule: Long-term hold strategy designed to ride stocks through extended growth.
Everest Rule: Aggressive strategy to capture profits during parabolic price moves.
Q3: What is the significance of the Green Line at Buy Price?
The Green Line represents your entry point (Buy Price) on the chart. It will appear from the buy date onwards, helping you track the performance of your stock relative to your entry.
Q4: Can I customize the Sell Strategy?
Yes! You can choose from the available Sell Rules (Ascender Rule, Midterm Rule, 40 Week Rule, Everest Rule) via an input option in the script. Each strategy has its own unique triggers based on price action, moving averages, and time-based conditions.
Q5: Does this script work for stocks and crypto?
Yes, this script is designed for both stocks and cryptocurrencies. It works on any asset where price data and timeframes are available.
Q6: How do the Weekly Moving Averages (WSMA) work in this strategy?
The script uses weekly moving averages (WSMA) to track longer-term trends. These are essential for some of the sell rules, such as the Midterm Rule and 40 Week Rule, which rely on the stock's movement relative to the 40-week moving average.
Q7: Will the script plot a Sell Signal immediately after the Buy Date?
No, sell signals will only be plotted after the Buy Date. This ensures that the sell strategy is relevant to your actual holding period and avoids premature triggers.
Q8: How do I interpret the Sell Signal?
The script will plot a Red Sell Signal above the bar when the sell conditions are met, based on the selected strategy. This indicates that it may be a good time to exit the position according to your chosen rule.
Q9: Can I use this strategy on different timeframes?
Yes, you can apply the script to any timeframe. However, some sell strategies, like the Midterm Rule and 40 Week Rule, are designed to work best with weekly data, so it's recommended to use these strategies with longer timeframes.
Q10: Does this script have any alerts?
Yes! The script supports alert conditions that will notify you when the sell conditions are met according to your selected rule. You can set up alerts to stay informed without needing to watch the chart constantly.
Q11: What if I want to disable some of the sell rules?
You can select your preferred sell rule using the "Select Sell Rule" dropdown. If you don’t want to use a particular rule, simply choose a different strategy or leave it inactive.
------------------------------
Disclaimer:
This strategy is intended for educational purposes only. It should not be considered financial advice. Always perform your own research and consult with a professional before making any trading decisions. Trading involves significant risk, and you should never trade with money you cannot afford to lose.

SMA Proximity Signal with Trend TableSummary of the Script:
This Pine Script is designed to provide a variety of technical analysis signals based on Simple Moving Averages (SMAs) and market trends across different timeframes. The script combines multiple indicators, such as the SMA crossover, proximity conditions, and trend analysis, along with visual markers and support/resistance lines. Below is a detailed breakdown of the key features:
The script detects crossovers between SMA1 and SMA2 and SMA1 and SMA3, marking them with green circles exactly at the crossover price level (not on the candles).
The crossover events are identified using ta.crossover and ta.crossunder functions.
Additional circles are drawn when other SMAs are in proximity (narrow stage)
Elephant Candle Pattern:
The script identifies "Elephant Candles" based on a large candle body relative to the overall size of the candle, using the condition where the candle body is at least 80% of the total candle size and at least 1.5 times the average candle size.
These candles are marked with an elephant emoji 🐘 at the top of the candle.
Trend Analysis Across Multiple Timeframes:
The script calculates the trend for different timeframes using the SMA20 of each timeframe:
5m, 15m, 1h, 4h, and 1D
It compares the current SMA20 to its previous value to determine whether the trend is Up, Down, or Flat.
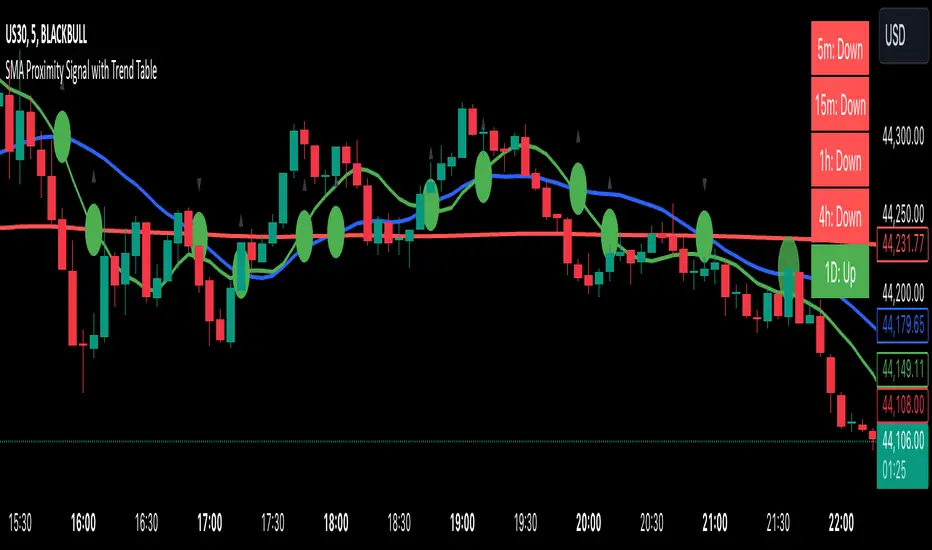
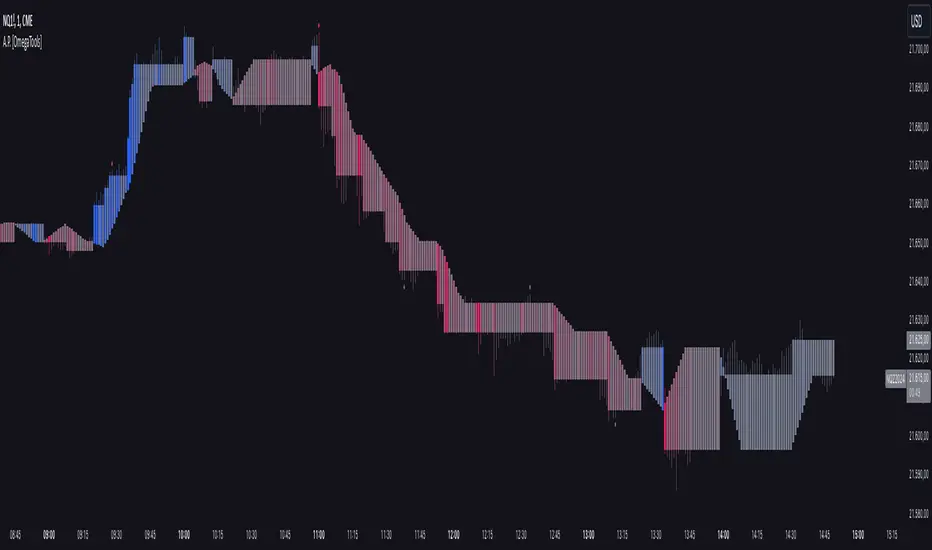
Alternative Price [OmegaTools]The Alternative Price script is a sophisticated and flexible indicator designed to redefine how traders visualize and interpret price data. By offering multiple unique charting modes, robust customization options, and advanced features, this tool provides a comprehensive alternative to traditional price charts. It is particularly useful for identifying market trends, detecting patterns, and simplifying complex data into actionable insights.
This script is highly versatile, allowing users to choose from five distinct charting modes: Candles, Line, Channel, Renko, and Bubbles. Each mode serves a unique purpose and presents price information in an innovative way. When using this script, it is strongly recommended to hide the platform’s default price candles or chart data. Doing so will eliminate redundancy and provide a clearer and more focused view of the alternative price visualization.
The Candles mode offers a traditional candlestick charting style but with added flexibility. Users can choose to enable smoothed opens or smoothed closes, which adjust the way the open and close prices are calculated. When smoothed opens are enabled, the opening price is computed as the average of the actual open price and the closing prices of the previous two bars. This creates a more gradual representation of price transitions, particularly useful in markets prone to sudden spikes or irregularities. Similarly, smoothed closes modify the closing price by averaging it with the previous close, the high-low midpoint, and an exponential moving average of the high-low-close mean. This technique filters out noise, making trends and price momentum easier to identify.
In the Line mode, the script displays a simple line chart that connects the smoothed closing prices. This mode is ideal for traders who prefer minimalism or need to focus on the overall trend without the distraction of individual bar details. The Channel mode builds upon this by plotting additional lines representing the highs and lows of each bar. The resulting visualization resembles a price corridor that helps identify support and resistance zones or price compression areas.
The Renko mode introduces a more advanced and noise-filtering method of visualizing price movements. Renko charts, constructed using the ATR (Average True Range) as a baseline, display blocks that represent a specific price range. The script dynamically calculates the size of these blocks based on ATR, with separate thresholds for upward and downward movements. This makes Renko mode particularly effective for identifying sustained trends while ignoring minor price fluctuations. Additionally, the open and close values of Renko blocks can be smoothed to further refine the visualization.
The Bubbles mode represents price activity using circles or bubbles whose size corresponds to relative volume. This mode provides a quick and intuitive way to assess market participation at different price levels. Larger bubbles indicate higher trading volumes, while smaller bubbles highlight periods of lower activity. This visualization is particularly valuable in understanding the relationship between price movements and market liquidity.
The coloring of candles and other chart elements is a core feature of this script. Users can select between two color modes: Normal and Volume. In Normal mode, bullish candles are displayed in the user-defined bullish color, while bearish candles use the bearish color. Neutral elements, such as midpoints or undecided price movements, are shaded with a neutral color. In Volume mode, the candle colors are dynamically adjusted based on trading volume. A gradient color scale is applied, where the intensity of the bullish or bearish colors reflects the volume for that particular bar. This feature allows traders to visually identify periods of heightened activity and associate them with specific price movements.
Engulfing patterns, a popular technical analysis tool, are automatically detected and marked on the chart when the corresponding setting is enabled. The script identifies long engulfing patterns, where the current bar's range completely encompasses the previous bar’s range and indicates a potential bullish reversal. Similarly, short engulfing patterns are identified where the current bar fully engulfs the previous bar in the opposite direction, suggesting a bearish reversal. These patterns are visually highlighted with circular markers to draw the trader’s attention.
Each feature and mode is highly customizable. The colors for bullish, bearish, and neutral movements can be personalized, and the thresholds for patterns or smoothing can be fine-tuned to match specific trading strategies. The script's ability to toggle between various modes makes it adaptable to different market conditions and analysis preferences.
In summary, the Alternative Price script is a comprehensive tool that redefines the way traders view price charts. By offering multiple visualization modes, customizable features, and advanced detection algorithms, it provides a powerful way to uncover market trends, volume relationships, and significant patterns. The recommendation to hide default chart elements ensures that the focus remains on this innovative tool, enhancing its usability and clarity. This script empowers traders to gain deeper insights into market behavior and make informed trading decisions, all while maintaining a clean and visually appealing chart layout.
Keep in mind that some of the modes of this indicator might not reflect the actual closing price of the underlying asset, before opening a trade, check carefully the actual price!
MktCumTickThis script is a market sentiment indicator that calculates the cumulative TICK (Trade Imbalance Sentiment) for four major markets: NYSE (New York Stock Exchange), NASDAQ (National Association of Securities Dealers Automated Quotations), Dow Jones, and AMEX (American Stock Exchange).
Here's a breakdown of the script:
1. Market data requests: The script requests data for the four markets, including:
- TICK (Trade Imbalance Sentiment) data
- HLC3 (High, Low, Close) data
- ADVN (Advancing issues), DECL (Declining issues), and UNCH (Unchanged issues) data
2. Cumulative TICK calculation: The script calculates the cumulative TICK for each market by dividing the TICK data by the maximum TICK value for each market.
3. Plotting: The script plots the cumulative TICK values for each market as separate lines on the chart.
4. Background color: The script changes the background color of the chart based on the cumulative TICK values. If all four markets have decreasing cumulative TICK values, the background color turns red. If all four markets have increasing cumulative TICK values, the background color turns green.
The purpose of this indicator is to provide a visual representation of market sentiment across multiple markets. By analyzing the cumulative TICK values, traders can gain insights into market trends and make more informed trading decisions.
Some possible uses of this indicator include:
- Identifying market trends and sentiment
- Confirming trade entries and exits
- Monitoring market conditions and adjusting trading strategies accordingly

Weekly Bullish Pattern DetectorThis script is a TradingView Pine Script designed to detect a specific bullish candlestick pattern on the weekly chart. Below is a detailed breakdown of its components:
1. Purpose
The script identifies a four-candle bullish pattern where:
The first candle is a long green (bullish) candlestick.
The second and third candles are small-bodied candles, signifying consolidation or indecision.
The fourth candle is another long green (bullish) candlestick.
When this pattern is detected, the script:
Marks the chart with a visual label.
Optionally triggers an alert to notify the trader.
2. Key Features
Overlay on Chart:
indicator("Weekly Bullish Pattern Detector", overlay=true) ensures the indicator draws directly on the price chart.
Customizable Inputs:
length (Body Size Threshold):
Defines the minimum percentage of the total range that qualifies as a "long" candle body (default: 14%).
smallCandleThreshold (Small Candle Body Threshold):
Defines the maximum percentage of the total range that qualifies as a "small" candle body (default: 10%).
Candlestick Property Calculations:
bodySize: Measures the absolute size of the candle body (close - open).
totalRange: Measures the total high-to-low range of the candle.
bodyPercentage: Calculates the proportion of the body size relative to the total range ((bodySize / totalRange) * 100).
isGreen and isRed: Identify bullish (green) or bearish (red) candles based on their open and close prices.
Pattern Conditions:
longGreenCandle:
Checks if the candle is bullish (isGreen) and its body percentage exceeds the defined length threshold.
smallCandle:
Identifies small-bodied candles where the body percentage is below the smallCandleThreshold.
consolidation:
Confirms the second and third candles are both small-bodied (smallCandle and smallCandle ).
Bullish Pattern Detection:
bullishPattern:
Detects the full four-candle sequence:
The first candle (longGreenCandle ) is a long green candle.
The second and third candles (consolidation) are small-bodied.
The fourth candle (longGreenCandle) is another long green candle.
Visualization:
plotshape(bullishPattern):
Draws a green label ("Pattern") below the price chart whenever the pattern is detected.
Alert Notification:
alertcondition(bullishPattern):
Sends an alert with the message "Bullish Pattern Detected on Weekly Chart" whenever the pattern is found.
3. How It Works
Evaluates Candle Properties:
For each weekly candle, the script calculates its size, range, and body percentage.
Identifies Each Component of the Pattern:
Checks for a long green candle (first and fourth).
Verifies the presence of two small-bodied candles (second and third).
Detects and Marks the Pattern:
Confirms the sequence and marks the chart with a label if the pattern is complete.
Sends Alerts:
Notifies the trader when the pattern is detected.
4. Use Cases
This script is ideal for:
Swing Traders:
Spotting weekly patterns that indicate potential bullish continuations.
Breakout Traders:
Identifying consolidation zones followed by upward momentum.
Pattern Recognition:
Automatically detecting a commonly used bullish formation.
5. Key Considerations
Timeframe: Works best on weekly charts.
Customization: The thresholds for "long" and "small" candles can be adjusted to suit different markets or volatility levels.
Limitations:
It doesn't confirm the pattern's success; further analysis (e.g., volume, support/resistance levels) may be required for validation
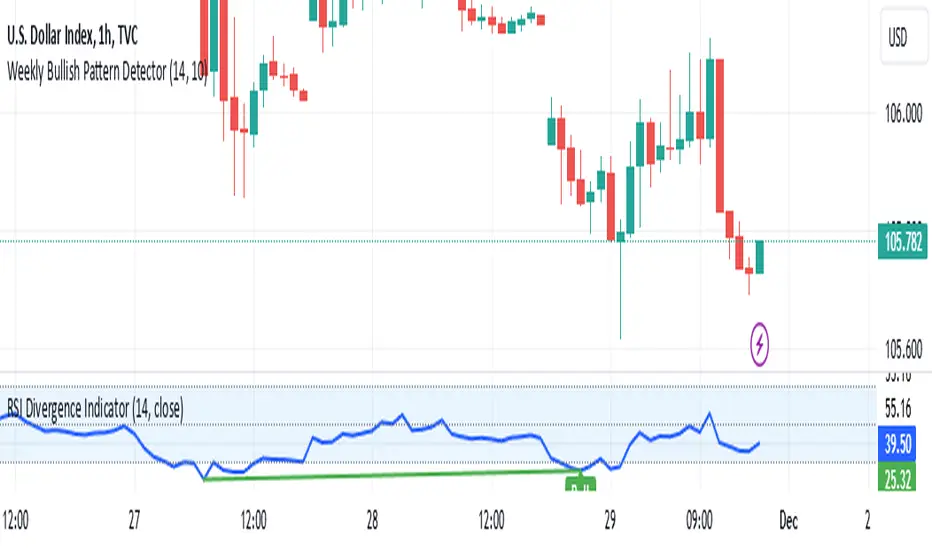
Customizable Multi-Timeframe Doji with Ray and Editable LabelScript Overview
Script Name: Customizable Multi-Timeframe Doji Candle Levels with Ray and Editable Label
Purpose: This script helps traders identify significant price levels based on high timeframe Doji candles, allowing them to visualize key areas of support, resistance, entry, and exit. By plotting real-time Doji levels from higher timeframes directly on the current chart, traders can easily spot areas where market indecision or potential trend reversals have previously occurred, making these levels highly relevant for future price action.
How the Script Works
This script detects Doji candles on a selected higher timeframe (e.g., daily, weekly, monthly) and plots a ray at the Doji’s closing level on the current chart. The Doji candle formation, characterized by an open and close that are very close or equal, is often an indicator of market indecision. By identifying these Doji levels from high timeframes, the script provides traders with insight into where strong support and resistance zones may form.
The script continuously monitors and updates the Doji level based on the selected timeframe, ensuring that only the latest detected Doji candle is displayed on the chart, helping traders avoid clutter and focus on the most recent data.
Core Components and Calculations
1 Doji Detection Logic:
-The script calculates the Doji candle formation based on a small body percentage (defined by the C_DojiBodyPercent parameter) and relative symmetry in upper and lower shadows (defined by C_ShadowPercent and C_ShadowEqualsPercent).
-A Doji is considered valid when the open and close prices are nearly equal, and the shadows are symmetric within the defined parameters, indicating indecision.
2 Multi-Timeframe Data Retrieval:
-Using the request.security() function, the script fetches open, high, low, and close prices from the specified higher timeframe. It applies Doji detection logic to this higher timeframe data.
-barmerge.lookahead_on and barmerge.gaps_on ensure real-time updates, so the Doji level is immediately reflected on the chart when detected.
3 Ray and Label Plotting:
-When a Doji candle is detected on the selected timeframe, the script plots a ray at the Doji's close price, extending forward on the chart.
-Customizable options for the ray, including color, width, and style (solid, dotted, or dashed), help traders visually differentiate the Doji levels from other chart elements.
-An editable label can be positioned alongside the ray to denote the Doji level, with customizable text, color, background, and size to provide additional context.
4 Automatic Line and Label Management:
-The script dynamically deletes any previous ray and label when a new Doji is detected. This approach minimizes chart clutter and ensures that only the most recent Doji level from the higher timeframe is displayed.
Customization Options
1 Timeframe Selection:
Users can choose any timeframe (e.g., hourly, daily, weekly, monthly) to display Doji levels based on their specific trading strategy.
2 Ray and Label Appearance:
Ray: Customize color, width, and line style (solid, dotted, dashed) for better visibility and integration with the chart’s theme.
Label: Customize the label text, background color, text color, text size, and position (above, below, left, or right of the ray) for a personalized view.
How to Use This Script
1 Select the Target Timeframe for Doji Detection: Choose a high timeframe (such as daily or weekly) to view Doji-based support/resistance levels.
2 Set Custom Ray and Label Parameters : Adjust the visual aspects of the ray and label to align with your chart setup and make the Doji level stand out.
3 Interpretation of Doji Levels: Use the plotted Doji levels as potential support or resistance zones. Since Doji candles reflect market indecision, they often precede significant price reversals or strong continuation moves. By analyzing these levels, traders can:
- Identify key support/resistance zones based on historical market indecision.
- Set entry and exit levels around these zones to capitalize on potential reversals or
continuations.
-Spot confluence areas where the Doji level aligns with other indicators or technical patterns.
Recommended Chart Setup
For optimal clarity, use this script on a clean chart, free from overlapping indicators. This script is designed to work independently, so avoid layering multiple support/resistance scripts unless essential to avoid clutter. A clean chart helps ensure that Doji levels are readily visible, enabling a clear focus on significant levels relevant to your trading strategy.

Ultimate Multi-Physics Financial IndicatorThe Ultimate Multi-Physics Financial Indicator is an advanced Pine Script designed to combine various complex theories from physics, mathematics, and statistical mechanics to create a holistic, multi-dimensional approach to market analysis. Let’s break down the core concepts and how they’re applied in this script:
1. Fractal Geometry: Recursive Pattern Recognition
Purpose: This part of the script uses fractal geometry to recursively analyze price pivots (highs and lows) for detecting patterns.
Fractals: The fractalHigh and fractalLow signals represent key turning points in the market. The script goes deeper by recursively analyzing layers of pivot sequences, adding "depth" to the recognition of patterns.
Recursive Depth: It breaks down each detected pivot into smaller components, giving more nuance to market pattern recognition. This provides a broader context for how prices have behaved historically at various levels of recursion.
2. Quantum Mechanics: Adaptive Probabilistic Monte Carlo with Correlation
Purpose: This component integrates randomness (from Monte Carlo simulations) with current market behavior using correlation.
Randomness Weighted by Correlation: By generating random probabilities and weighting them based on how well the market aligns with recent trends, it creates a probabilistic signal. The random values are scaled by a correlation factor (close prices and their moving average), adding adaptive elements where randomness is adjusted by current market conditions.
3. Thermodynamics: Adaptive Efficiency Ratio (Entropy-Like Decay)
Purpose: This section uses principles from thermodynamics, where efficiency in price movement is dynamically adjusted by recent volatility and changes.
Efficiency Ratio: It calculates how efficiently the market is moving over a certain period. The "entropy decay factor" reflects how stable the market is. Higher entropy (chaos) results in lower efficiency, while stable periods maintain higher efficiency.
4. Chaos Theory: Lorenz-Driven Market Oscillation
Purpose: Instead of using a basic Average True Range (ATR) indicator, this section applies chaos theory (using a Lorenz attractor analogy) to describe complex market oscillations.
Lorenz Attractor: This models market behavior with a chaotic system that depends on the historical price changes at different time intervals. The attractor value quantifies the level of "chaos" or unpredictability in the market.
5. String Theory: Multi-Layered Dimensional Analysis of RSI and MACD
Purpose: Combines traditional indicators like the RSI (Relative Strength Index) and MACD (Moving Average Convergence Divergence) with momentum for multi-dimensional analysis.
Interaction of Layers: Each layer (RSI, MACD, and momentum) is treated as part of a multi-dimensional structure, where they influence one another. The final signal is a blended outcome of these key metrics, weighted and averaged for complexity.
6. Fluid Dynamics: Adaptive OBV (Pressure-Based)
Purpose: This section uses fluid dynamics to understand how price movement and volume create pressure over time, similar to how fluids behave under different forces.
Adaptive OBV: Traditional OBV (On-Balance Volume) is adapted by using statistical smoothing to measure the "pressure" exerted by volume over time. The result is a signal that shows where there might be building momentum or pressure in the market based on volume dynamics.
7. Recursive Synthesis of Signals
Purpose: After calculating all the individual signals (fractal, quantum, thermodynamic, chaos, string, and fluid), the script synthesizes them into one cohesive signal.
Recursive Feedback Loop: Each signal is recursively influenced by others, forming a feedback loop that allows the indicator to continuously learn from new data and self-adjust.
8. Signal Smoothing and Final Output
Purpose: To avoid noise in the output, the final combined signal is smoothed using an Exponential Moving Average (EMA), which helps stabilize the output for easier interpretation.
9. Dynamic Color Coding Based on Signal Extremes
Purpose: Visual clarity is enhanced by using color to highlight different levels of signal strength.
Color Coding: The script dynamically adjusts colors (green, orange, red) based on the strength of the final signal relative to its percentile ranking in historical data, making it easier to spot bullish, neutral, or bearish signals.
The "Ultimate Multi-Physics Financial Indicator" integrates a diverse array of scientific principles — fractal geometry, quantum mechanics, thermodynamics, chaos theory, string theory, and fluid dynamics — to provide a comprehensive market analysis tool. By combining probabilistic simulations, multi-dimensional technical indicators, and recursive feedback loops, this indicator adapts dynamically to evolving market conditions, giving traders a holistic view of market behavior across various dimensions. The result is an adaptive and flexible tool that responds to both short-term and long-term market changes

Distance between EMA 50-100/100-150This script calculates and plots the percentage difference between the 50-period, 100-period, and 150-period Exponential Moving Averages (EMA) on a TradingView chart. The aim is to provide a clear visual representation of the market's momentum by analyzing the distance between key EMAs over time.
Key features of this script:
1. EMA Calculation : The script computes the EMA values for 50, 100, and 150 periods and calculates the percentage difference between EMA 50 and 100, and between EMA 100 and 150.
2. Custom Threshold : Users can adjust a threshold percentage to highlight significant divergences between the EMAs. A default threshold is set to 0.1%.
3. Visual Alerts : When the percentage difference exceeds the threshold, a visual marker appears on the chart:
Green Circles for bullish momentum (positive divergence),
Red Circles for bearish momentum (negative divergence),
Diamonds to indicate the first occurrence of new bullish or bearish signals, allowing users to catch fresh market trends.
4. Dynamic Plotting : The script plots two lines representing the percentage difference for each EMA pair, offering a quick and intuitive way to monitor trends.
Ideal for traders looking to gauge market direction using the relationship between multiple EMAs, this script simplifies analysis by focusing on key moving average interactions.

Options Series - Ichimoku Cloud and HalfTrend
The provided script combines two powerful technical indicators, Ichimoku Cloud and HalfTrend, to create a hybrid trading tool. Here's an analysis of the key components and how they work together:
Ichimoku Cloud and HalfTrend
⭐ 1. Indicator Title and Settings:
The script sets the title as "Options Series - Ichimoku Cloud and HalfTrend" and uses the overlay=true option to display the indicators directly on the price chart.
⭐ 2. Color Definitions:
Several colors are defined for later use:
Green and Red for different types of candles and signals.
Fluorescent Colors for highlighting significant trends or changes in market conditions.
⭐ 3. Ichimoku Cloud Setup:
The Ichimoku Cloud is a comprehensive indicator used to identify support, resistance, and trend direction. Here’s how the script configures it:
Conversion Periods, Base Periods, Lagging Span 2 Periods, and Displacement are customizable via input options, giving flexibility to adjust Ichimoku settings based on different market conditions.
The function donchian(len) calculates the Donchian Channel average, which is used to define the Conversion Line and Base Line. The crossover of these lines is crucial in determining bullish or bearish trends.
Color Logic for Kijun Cross: If the Conversion Line is above the Base Line, the trend is bullish (green color), while a bearish trend is indicated by red. A neutral condition is marked with orange.
⭐ 4. HalfTrend Indicator Setup:
The HalfTrend indicator detects trend reversals based on high/low price deviations from a moving average:
Amplitude and Channel Deviation inputs allow users to control the sensitivity of the indicator.
showArrows and showChannels toggle the display of buy/sell arrows and trend channels.
maxLowPrice and minHighPrice variables are initialized to track significant high/low points during the trend, used to confirm trend reversals.
⭐ 5. ATR and Trend Calculations:
The Average True Range (ATR) is used to calculate the volatility-based channels. The script calculates atr2 and uses this to create atrHigh and atrLow for plotting the channel.
The trend detection logic is as follows:
When the trend is upward, the script seeks confirmation by comparing the high moving average with previous lows, signaling a continuation of the uptrend if it holds.
Conversely, a downtrend is confirmed when the low moving average exceeds previous highs.
⭐ 6. Customized Candle Coloring:
A custom color scheme is applied to candles based on a combination of trend direction and Ichimoku Cloud signals:
GreenFluorescent for strong bullish conditions where price is above the HalfTrend line, and the Conversion Line is above the Base Line.
RedFluorescent for strong bearish conditions, with price below the HalfTrend line and Conversion Line below the Base Line.
Gray for neutral or indecisive conditions.
⭐ 7. Plots and Shapes:
The script plots various elements:
HalfTrend Line: The main trendline is plotted in either green (buy) or red (sell), with adjustable line width.
Ichimoku Base Line: This is plotted with the dynamic color based on crossovers.
Buy/Sell Arrows: These are drawn on the chart when valid buy/sell conditions are met.
Custom Candles: The script overrides default chart candles with custom-colored candles based on the previously discussed logic.
⭐ 8. Improvements:
Optimization: Parameters like the amplitude, channel deviation, and Ichimoku periods can be fine-tuned based on backtesting results to maximize performance for specific assets or timeframes.
Alerts: The script could be enhanced by adding alert conditions for real-time buy/sell notifications, leveraging alertcondition() in Pine Script.
In summary, this script merges two trend-following techniques for a multi-faceted view of the market, using visual cues and trendline logic to provide a robust trading tool.
🚀 Conclusion:
Trend-Following System: The combination of Ichimoku Cloud and HalfTrend provides a comprehensive view of both long-term trends (via Ichimoku) and shorter-term reversals (via HalfTrend).
Visual Signals: The script includes clear visual signals (arrows and custom-colored candles) to help traders quickly spot buy/sell opportunities.
Dynamic Customization: Through user inputs, this indicator can be tailored to different market conditions, making it versatile.
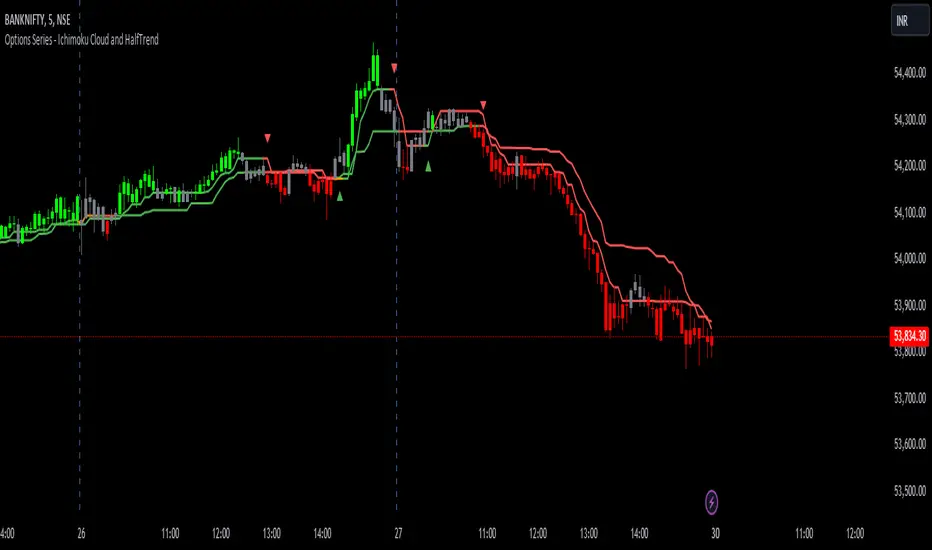
Geometric Mean IndicatorThis script calculates and plots the Geometric Mean (GM) of two significant price levels (in this case, moving averages) to identify balance points or equilibrium levels in the market.
Key Components of the Script:
Input Variables:
length1: Defines the period for the first moving average (representing the first radius 𝑥x).
length2: Defines the period for the second moving average (representing the second radius
𝑦y).
Moving Averages (Price Levels):
ma1: The first moving average (calculated using the closing price over the period defined by length1).
ma2: The second moving average (calculated using the closing price over the period defined by length2).
Geometric Mean (GM) Calculation:
The geometric mean between the two moving averages is calculated as:
GM = sqrt(ma1 * ma2)
This value represents the midpoint or balance between the two price levels (analogous to the geometric mean between the radii in the mathematical discovery).
Plotting the Values:
The script plots:
ma1: First moving average (blue line).
ma2: Second moving average (red line).
geometric_mean: The geometric mean of the two moving averages (green line), which serves as the dynamic equilibrium point.
Visual Markers for Crossovers:
The script detects when the price crosses above or below the geometric mean:
Green markers (below the bar) indicate a crossover above the geometric mean.
Red markers (above the bar) indicate a crossover below the geometric mean.
Purpose of the Indicator:
The Geometric Mean Indicator is designed to:
Highlight equilibrium points: The geometric mean between two price levels can signal areas where the market is balanced or poised for a potential breakout.
Detect potential trend reversals: When the price crosses above or below the geometric mean, it can indicate shifts in market momentum, similar to how the GM in geometry represents a transition point.
How to Use:
Dynamic Equilibrium: The geometric mean (green line) represents a balance between two price levels (moving averages) and can act as support or resistance.
Price Crossovers: Watch for price crossing the geometric mean to identify potential trend changes or areas of significant price action.
Adjust Inputs: You can modify the lengths of the moving averages (length1 and length2) to adjust the sensitivity of the indicator based on different timeframes or strategies.
Summary in Context of the Geometric Proof:
The script applies the geometric concept of the Geometric Mean (GM) as a balance point between two radii (represented by moving averages in this case).
It mirrors the idea that the GM is the midpoint of the tangent slope between two circles, where the moving averages (or price levels) serve as the "radii" in the market context.